Are you a DIY Investor? Good for you! I’m a DIY kind of guy. I do my own pool maintenance, cut my own lawn, and change my own oil. Believe it or not, I cut my own hair. I became a DIY Investor just about the time Enron imploded. The first company stock I bought was TICO because I watched PBS interview and I thought, I like that guy. I trusted him and I bought his stock the next day.
As a DIY Investor I’ve made every mistake imaginable. In 2007, December 14 (my 25th wedding anniversary) I hired my first Wall Street Financial Advisor at . That was one of the of my financial life.
One of the things I really appreciated about my Financial Advisor (even thought he worked in a very broken system on Wall Street) was having someone on my team who had access to tons of tools and information that I just didn’t have.
If you’re a DIY Investor, I want to invite you to take advantage of BayRock Financial. I built BayRock to appeal to DIY Investors. My first recomendation is simple: Get Your Risk Number. Visit BayRockFinancial.com and click on the Blue Button at the top of the page next to the BayRock logo and take our 5 minute risk survey.
If you want to email me your investment statement, I’ll do a portfolio review to show you how much risk you have compared to how much risk you want. I’ll tell you what I’m doing with my money now and you’ll get to see why I recommend the BayRock Bull Bear Strategy for many (not all) of my current clients.
How BayRock Helps DIY Investors:
BayRock is dedicated to helping individual investors, families, and business owners manage the risk and opportunity of everyday life, recover from the unexpected, and realize their highest purpose.
-
-
Subscribe to the
-
-
-
Track Your Progress Download our
DIY Investor Blueprint
Whether you’re a DIY Investor or a professional Investment Advisor, you need to have a good plan for managing your wealth and while that includes managing your investment portfolio, there is much more to consider.
In my book, , I outline a holistic process for financial planning. The metaphor I use in the book is The Blueprint for Financial Success™.

The Blueprint for Financial Success™

DIY Investor Strategies
All good investment strategies are designed to maximmize returns and minimize risk. When I went to work on Wall Street at Morgan Stanley in the Wealth Management department, I was hoping to discover the secret sauce of the world’s best investment managers. I did learn a lot but the most valuable lesson I learned was that there is no perfect investment strategy no matter how sophisticated and no matter how smart the manager.
As a DIY Investor, you have access to the best investment strategies available and the cost is lower than ever before. With free trading and an almost infinite number of investments to choose from, the biggest problem for a DIY Investor is figuring out how to put it all together so that you have a higher probability of success.

What’s Your Risk Number?
Before reading further, please consider taking our 5 minute risk survey. The following investment ideas are based on your Risk Number.

Introducing the BayRock Bull Bear Strategy
The following content is for illustrative and educational purposes. Before you spend any time considering if the BayRock Bull Bear Portfolio Strategy is for you, I strongly encourage you to Get Your Risk Number. Taking our 5 Minute Risk Survey is the first step in learning how much risk you want, how much risk you have, and how much risk you need to meet your most important goals.
What’s Your Risk Number?
If you don’t know, please

For the record, I’m a and . I’m an Independent Fiduciary Investment Advisor and I’m making this video to announce some big changes I’ve made in my own investment portfolio.
Bull Bear Strategy for All Seasons
Over the last few years, we’ve been in a nice Bull Market. In 2020, we had a nasty Bear Market that lasted about 5 minutes and then we quickly shot up to all time highs. In 2021 the S&P 500 jumped to a fresh new highs 68 times. That is a Bull Market.
Unlike Houston, Texas “The Market” has four different seasons.
-
Bull Market = Uptrend
-
Bear Market = Downtrend
-
Consolidation = Sideways
-
Uncertainty = Volatility
Tis the Season of Uncertainty
Volatility creates big swings in the market in both directions; when the stock market rises and falls more than one percent over a sustained period of time, we call that a “volatile” market. Lately we’ve had a couple of times when the market rose and fell more than one percent in a single day.
The Market
What’s in Your Portfolio!?
-
SPY = S&P 500, a Proxy for The Market
-
DIA = The Dow Industrial, top 30
-
QQQ = NASDAQ, technology, growth
Asset Allocation & Sectors
-
IWM = Small Cap
-
MDY = Mid Cap
-
SMH = Chip Makers (Semi Conductors)
-
ARKK = Innovation
-
XBI = Biotechnology
-
TLT = Bond Proxy
-
EFA = International and Emerging Markets
Trends and Charts
The Trend is Your Friend – Until the End!
6 Month Daily Chart
Support and Resistance
Simple Moving Averages
-
8 Days
-
50 Days
-
200 Days
Bull Bear Strategy
-
Bullish Trend = Long the Market
-
Sideways Trend = Half Cash
-
Bearish Trend = Short the Market
Risk Analysis
-
BayRock Bull = Long
-
BayRock Half Cash = 50% Cash
-
BayRock Bear = Short
Inverse ETF List
ETF Pros and Cons
-
Leveraged ETF = Risk!
-
Inverse ETF = Double Risk!
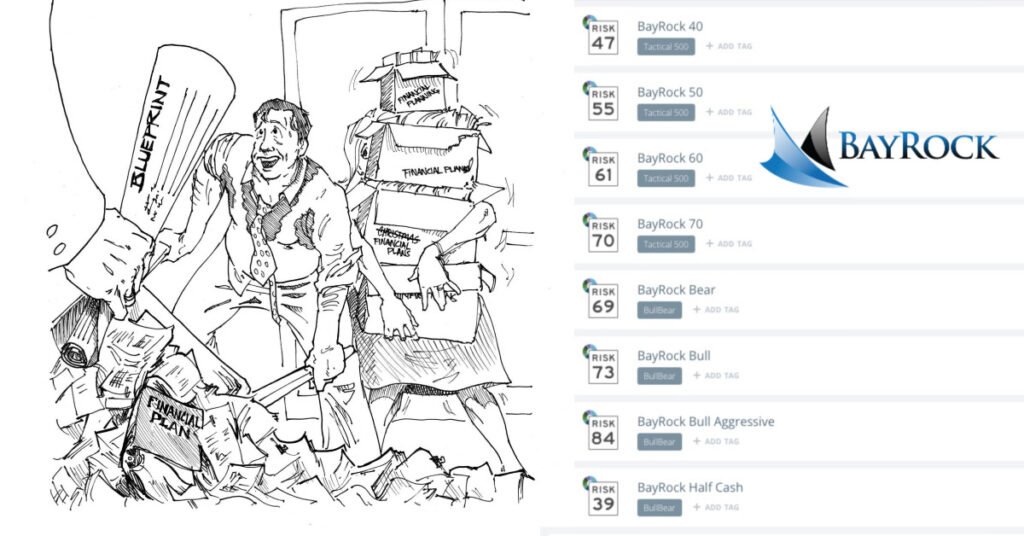
Click the link below any of the following report titles to instantly download the complete RiskAlyze Report:

BayRock 40 compared to First Trust portfolio with a 24 Risk Number


BayRock 50 compared to First Trust portfolio with a 24 Risk Number


BayRock 60 compared to First Trust portfolio with a 24 Risk Number


BayRock 70 compared to First Trust portfolio with a 24 Risk Number

BayRock 80 compared to First Trust portfolio with a 24 Risk Number


BayRock Bull vs BayRock Half Cash (the same portfolio model as BayRock Bull with Half Cash)


BayRock Bull vs BayRock Bear (the same portfolio model as BayRock Bull with Leveraged and Inverse ETFs and Half Cash)
Click Here to Download this RiskAlyze Report


BayRock Half Cash vs BayRock Bear (the same portfolio model as BayRock Half Cash with Leveraged and Inverse ETFs and Half Cash)


First Trust 24 compared to BayRock Half Cash


About RiskAlyze Reports
The Asset Allocation Heatmap expresses the weighted potential upside and downside that each allocation contributes to the overall portfolio, along with the portion of each allocation’s potential downside that has been diversified away due to correlation.
The percentages shown represent a given allocation’s potential performance, contextualized to its weight within the overall portfolio. The green percentage represents an allocation’s portfolio-weighted potential upside, while the red percentage represents its total portfolio-weighted potential downside. The gold percentage represents the portion of that total portfolio-weighted potential downside that has been diversified away due to correlation.
The Risk/Reward Heatmap visually expresses the probable risk (red bar), probable return (green bar) and the amount of risk that is likely (probable) to be diversified out by inverse correlations (gold bar) given the data model selected.
The green bar visually expresses the amount of probable return each investment contributes to the portfolio; dollar amount weighted. The red bar visually expresses the amount of probable downside risk each investment contributes to the portfolio; dollar amount weighted. The gold bar visually expresses the amount of probable downside risk which is likely offset by diversification effects generated by other investments in the portfolio. The Risk Reward Heatmap is a visual representation of the investment analysis which includes historical return, volatility and correlation statistics calculated using a long-term average of +0% for the S&P 500, 0bps change in the Ten Year US Treasury Rate, and correlation and volatility data from 2008 to present. The Six Month 95% Historical Range is calculated from the standard deviation of the portfolio (via covariance matrix), and represents a hypothetical statistical probability, but there is no guarantee any investments would perform within the range. There is a 5% probability of greater losses. The underlying data is updated as of the previous day’s market close price, and the results may vary with each use and over time. The investments considered were determined by Jim Munchbach, CFP®, CLU®, ChFC®, CPCU® on May 4, 2022 for illustrative and educational purposes only.
Educational
These calculations are designed to be informational and educational only and do not constitute investment advice. Investors should review their investment strategy periodically as financial circumstances change. The stress tests provided are a rough approximation of future financial performance should markets experience conditions similar to those shown. It is highly unlikely that such historical events will repeat themselves. The results presented by this stress test are hypothetical and may not reflect the actual growth of actual investments. Riskalyze and its affiliates are not responsible for the consequences of any decisions or actions taken in reliance upon or as a result of the information provided.
IMPORTANT: The projections or other information generated by Riskalyze regarding the likelihood of various investment outcomes are hypothetical in nature, do not reflect actual investment results and are not guarantees of future results. These figures may exclude commissions, sales charges or advisory fees which, if included, would have had a negative effect on the annual returns.
NOTE: These calculations do not report what happened to this portfolio during the noted market environment. The “this portfolio’s estimated performance” uses actual volatility and correlation statistics from Jan 1 2008 through present in conjunction with the noted rate of return (or loss) for the index shown to present an estimated performance should another environment like those presented occur again. For example, the “2013-Like Bull Market” scenario uses the portfolio’s actual volatility (as measured by standard deviation) and correlation statistics (using a correlation matrix) from January 1st 2008 through present while assuming the same return realized by the S & P 500 index in 2013 of 32%. Because the portfolios you are comparing have different dollar values, we’ve normalized the stress tests presented here to match the value of the compared portfolio.
BayRock Bull Bear Strategy DISCLAIMER:
The reports and images shown on this page should not be relied on as a substitute for official account statements.
All content on this page is for illustrative/educational purposes only. None of the strategies outlined here are available without first completing the BayRock Risk Survey – Additionally, investors are required to meet with a BayRock Fiduciary prior to engaging with BayRock Financial. To book your with a BayRock Practioner now –
The performance data quoted represents past performance. Past performance does not guarantee future results. Investment return and principal value will fluctuate so that an investor’s shares, when redeemed, may be worth more or less than their original cost. Current performance may be lower or higher than the performance information quoted. The performance quoted reflects the reinvestment of dividends and capital gains and is net of expenses.
Investors should consider the investment objectives, risks, charges and expenses of the investment company carefully before investing. The prospectus and, if available, the summary prospectus contain this and other important information about the investment company. Request a prospectus from the offering institution or your financial representative. Read carefully before investing.
Past performance may not be indicative of future results. Different types of investments involve varying degrees of risk. Future performance of any specific investments (including the investments provided by Jim Munchbach, Certified Financial Planner™, BayRock Financial, and/or Charles Schwab our primary Custodian) involve risk. RiskAlyze is a powerful tool to help take the guesswork out of your investment program. Please email [email protected] with questions.
IMPORTANT: The projections or other information generated by Riskalyze regarding the likelihood of various investment outcomes are hypothetical in nature, do not reflect actual investment results and are not guarantees of future results. These figures may exclude commissions, sales charges or advisory fees which, if included, would have had a negative effect on the annual returns. In instances where a security is unrecognized by the Riskalyze system or a security does not yet contain more than six (6) months of historical return data, Riskalyze may assign a benchmark/proxy to more accurately display risk and return analytics. In these instances Riskalyze will use the historical data associated with the benchmark/proxy indicated. Please see additional disclosures (included towards the end of this report) for any exchange traded funds and/or mutual funds referenced in any of the following reports.