If you pay any attention to the news, especially the financial news, you’re seeing a lot of stories with headlines that are designed to create panic. Sometimes they actually work. The #Fed is always a source for headlines because they have the power to turn a #Bull Market into a #Bear Market with one policy decision. The Fed has spoken and the markets have reacted the way the Fed wanted the markets to react – and much more, IMO.
Daily Reflections
Everyday, I read at least 20 financial stories from a number of sources. Sometimes I just stumble on something that catches my attention (that’s never a good way to be informed). Below is a story that caught my attention today from CNN. I’m a huge “NOT a fan” of CNN but I wanted to like this story even though my advice is don’t trust anything you get from CNN. Nonetheless, I’m adding this story to my 2022 Market Watch Wiki so I can quickly share it with a client or an investor who may be momentarily gripped by fear. And, yes, I’m occasionally one of those investors myself because I hate losing money
3 Charts Say Don’t Panic
Markets are down, but these charts explain why investors shouldn’t panic, even if they feel like a #Bear Market is imminent.
From CNN Business May 23, 2022 — What goes up must come down, and what goes #bull must go #bear. The conventional wisdom is that a bit of market madness is inevitable, cyclical and should give investors a potential buying opportunity.
But unfortunately this downswing doesn’t appear to be the devil we know.
Markets are contending with inflation rates at 40-year highs, Russia’s invasion of Ukraine, supply chain kinks and food shortages, rising interest rates, widespread predictions of a recession and .
Even the investors themselves are different. Covid-era stimulus checks, elevated unemployment and trading platforms aimed at young generations introduced a whole new group of up-and-coming traders to markets.
About 20 million people . A 2021 survey by Schwab found that 15% of all US stock market investors said they first began investing in 2020. #Factoid
These market players have never been through a period of high inflation and high interest rates, and the sudden change in the economic environment is adding to market turbulence, said Leo Grohowski, chief investment officer at BNY Mellon Wealth Management.
“What we’re seeing is a weeding out of investors that were flushed with liquidity. They bought first and asked questions with meme stocks, SPACs, NFTs, there was a lot of what I call indiscriminate buying. And now we’re seeing some indiscriminate selling,” he said.
Most investors are not prepared for this trading environment, Joshua Brown, co-founder and CEO of Ritholtz Wealth Management, said in a recent blog post. “This is one of the most treacherous environments I have ever seen, and I traded during the dot com meltdown, 9/11, Enron and Tyco and WorldCom and Lehman,” and a host of other crises.
As Berkshire Hathaway’s Charlie Munger said during the company’s recent shareholder meeting, the stock market has become “almost a mania of speculation.” He added that “we’ve got people who know nothing about stocks, being advised by stockbrokers who know even less.”
Still, as markets flirt with #bear territory — when a major index falls 20% or more from a recent high — some technical analysts don’t think there’s too much to worry about. These three charts show why it may not be time to hit the panic button. At least not yet.
Bull markets return more than bear markets lose

The 14 bull markets since 1932 have returned 175% on average, while the 14 bear markets starting in 1929 have resulted in an average loss of 39%, according to S&P Dow Jones Indices data.
Downturns are also much shorter than bull markets: Since 1932, bear markets have occurred, on average, every 56 months, or roughly four and a half years, according to the S&P. But they also last about one year on average, making them much shorter than the corresponding bull runs.
If we do avoid a recession, said Liz Young, head of investment strategy at SoFi, there could be a big bounceback.
In the periods since the 1970s when the S&P 500 fell more than 10% without a recession, stocks soared a within a few weeks of the drop. Today markets are trading as though they’re already pricing in a recession — so if the Federal Reserve can orchestrate a soft landing, the returns could be significant.
Sustained drawdowns aren’t a terrible entry point, historically speaking

The S&P 500 and Nasdaq Composite entered week seven of sustained losses this Friday. That’s the longest consecutive period of market turmoil since 2001 and 2002 for the S&P and Nasdaq respectively.
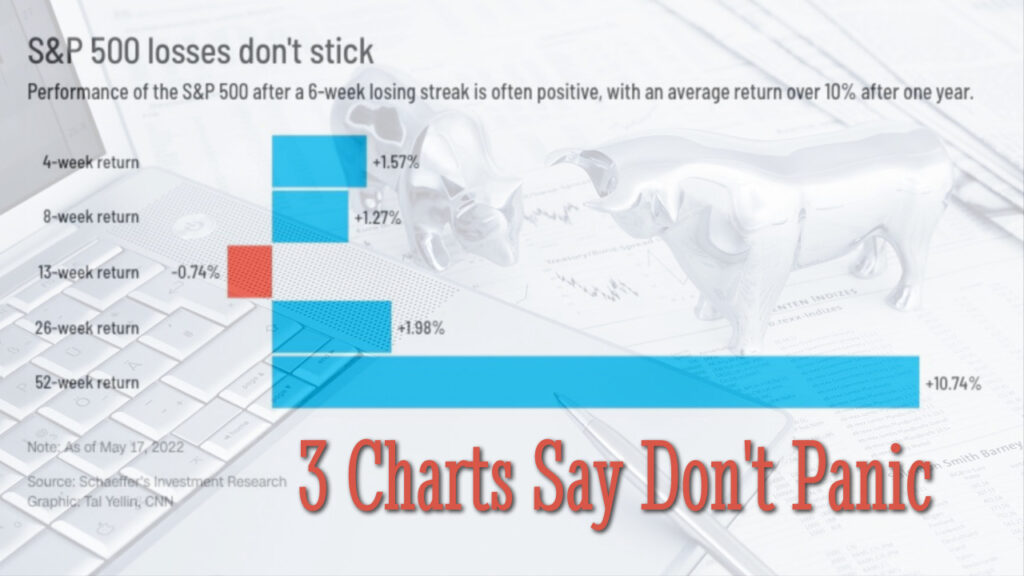
But previous returns don’t predict future performance, and recoveries from long S&P losing streaks are often positive. When analyzing 6-week losing streaks from the past, there has been an average return of more than 10% after one year.
“Now could be a decent time to make a short-term bet on the market,” wrote Rocky White, a senior quantitative analyst at Schaeffer’s Investment Services, who noted that in the four weeks after a losing streak, the S&P gained 1.57% on average, beating the typical return of 0.67%.
“When you get out to a year, there isn’t much difference in the returns, so long-term buy and hold investors have no reason to panic,” White added.
Volatility is unremarkable
To that point, we may be approaching a bear market, but we’re not in a panic. Even as the S&P 500 slides nearly 20% from its highs, volatility remains below its May peak.
“When you look at the volatility index [VIX] from a historical perspective, it’s not as high as you might anticipate it would be, given the amount of uncertainty we have right now,” said Howard Silverblatt, senior index analyst at S&P Dow Jones Indices.
The volatility index, which is widely known as Wall Street’s fear gauge, is much lower than it was during the prior two recessions. “We’re seeing a better mix of bulls and bears than we have in the past,” said Silverblatt, a good sign that the market is looking to find its support level.
What markets are experiencing now is a type of rolling capitulation, said Grohowski of BNY Mellon.